DevSecOps Metrics
Introduction
Metrics are a critical part of every DevSecOps program. DevSecOps metrics provide comprehensive insights into the current state of application security and serve as important indicators about continuous improvement of an organization’s software security posture over time. Armed with these metrics and actively using them to analyze and improve DevSecOps program implementation, organizations can better protect customer data and lower their risk of operation.
Definitions
Vulnerability is a security glitch, flaw, or weakness present in the software that can be used for breaking functionality or providing unauthorized access to application resources and makes an application vulnerable.
Severity is the property of a particular vulnerability which identifies how critical it is from a technical point of view.
Severity is defined based on evaluation of
- Impact of vulnerability exploitation (scale – High / Med / Low)
depending on
- Vulnerability exploitation probability (scale – High / Med / Low)
Impact is evaluated depending on the following factors:
- Impact on Confidentiality – estimated based on the type and volume of digital assets potentially compromised;
- Impact on Integrity – estimated based on volume of functionality which behaves as it is not supposed to;
- Impact on Availability – depends on general availability of application / digital service and their particular business functions.
Vulnerability exploitation probability is evaluated depending on the following factors:
- The widespread of this type of vulnerabilities (e.g., availability in OWASP Top-10, OWASP Mobile Top-10, SANS25 lists, etc.);
- General complexity of exploiting the vulnerability;
- Velocity of vulnerability exploitation.
Possible values of Vulnerability Severity are Critical / High / Medium / Low.
Priority is the property of a particular vulnerability which identifies how critical it is from a business point of view and prioritizes it within a backlog of security defects for the engineering team to fix. Possible values – Blocker / Critical / Major / Minor / Info.
Check-in is the moment when new code is merged into a source code branch.
Detected vulnerabilities are those identified (discovered) during a security scan within the DevSecOps continuous cycle. Vulnerabilities detected by application security tools during a security scan are also called “security issues”.
Opened vulnerabilities are detected and logged in a defect tracking system. Vulnerabilities logged into a defect tracking system are also called “security defects”. One security defect may include one or several security issues. Several detected security vulnerabilities (security issues) could be technically joined into one security defect depending on their nature and origin.
Resolved vulnerabilities are those marked by the engineering team in the defect tracking system as having been fixed, but not yet retested by security teams.
Confirmed vulnerabilities are those that have been resolved, retested in a new security scan, and reconfirmed by security as not present any more.
Fixed vulnerabilities are those that have been confirmed and removed from the production environment. This applies to vulnerabilities that previously escaped into the production environment and now have been completely removed.
Escaped vulnerabilities are those that have been detected and/or opened but not fixed during release and therefore have become available in the production environment / the build shipped to customers.
Security Gate defines a set of security criteria that have to be met before deploying new application code into a particular engineering environment (DEV / STAGE / pre-PROD / PROD).
Software Assets
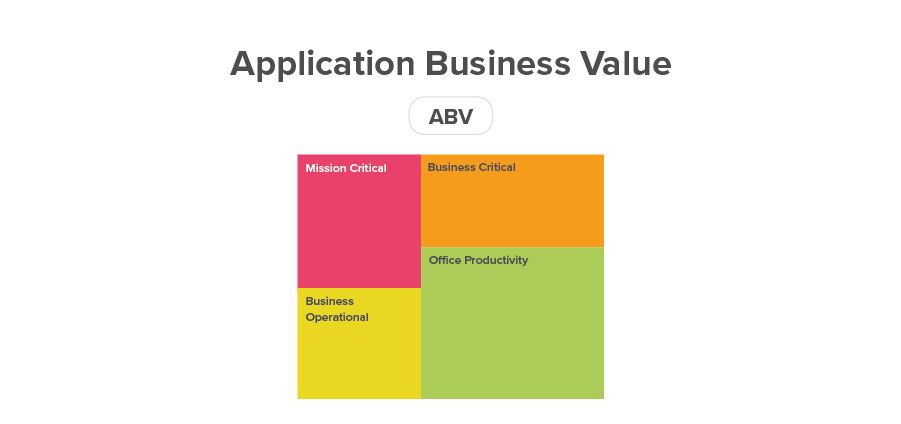
Application Business Value (ABV)
All software assets should be categorized by their Application Business Value (ABV):
- Mission Critical
- Business Critical
- Business Operational
- Office Productivity
Calculation
ABV = Number of software assets in each category—Mission Critical, Business Critical, Business Operational, Office Productivity.
Analysis
All mission critical and business critical applications should be covered by DevSecOps practices. The Security team will set different security gates for each ABV.
Software Security Coverage (SSC)
Definition
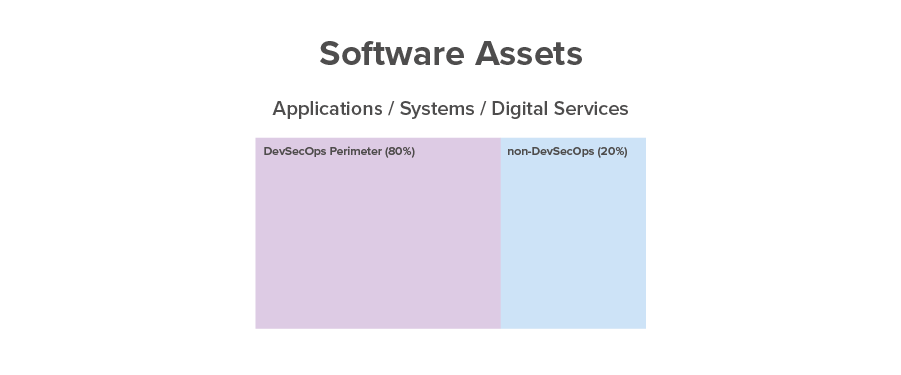
The Software Security Coverage (SSC) metric is the total number software assets that are covered by DevSecOps. Software Assets Total (SAT) is the total number of all applications, systems and microservices (software assets) used by an organization.
Calculation
SSC = Actual number of software assets covered by DevSecOps.
SAT = The total number of all software assets used by an organization.
SSCG = Planned number (goal) of software assets to be covered by DevSecOps.
SSC-T (%) = Number of software assets covered by DevSecOps / total number of software assets.
SSC-G (%) = Number of software assets covered by DevSecOps / SSC Goal.
Analysis
Security Strategy defines the SSCG as the goal to be achieved within a specified time, such as a quarter or a year. SSC-T (%) for mission critical and business critical applications should be close to 100%. When SSC-G (%) is less than 100%, the focus is on achieving this goal. When SSC-G (%) is close to 100%, the security team needs to define the new SSCG to bring overall over time SSC-T (%) close to 100%.
Codebase
Source Lines of Code (SLOC)
Definition
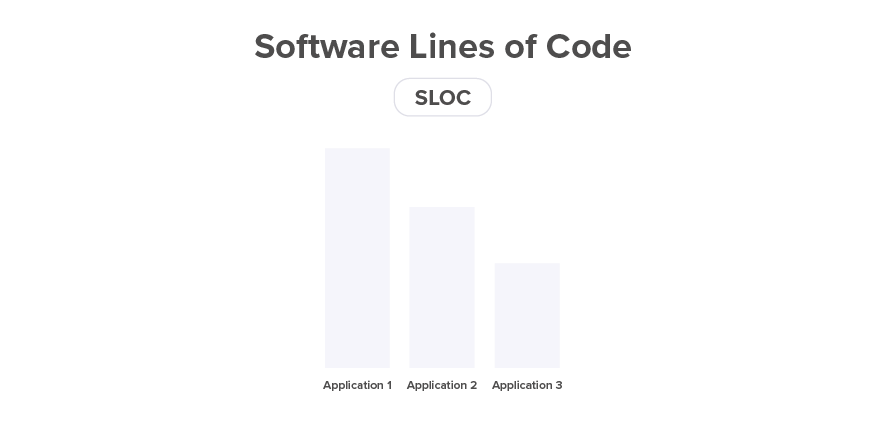
Source Lines of Code (SLOC) is the number of lines of source code for a particular application including all modules, components, and services this application consists of.
Calculation
SLOC = Number of lines of code in the application source code repository.
Analysis
This metric represents the size of an application. SLOC is used later in this document to calculate the Security Risk Density (SRD) for a specific application.
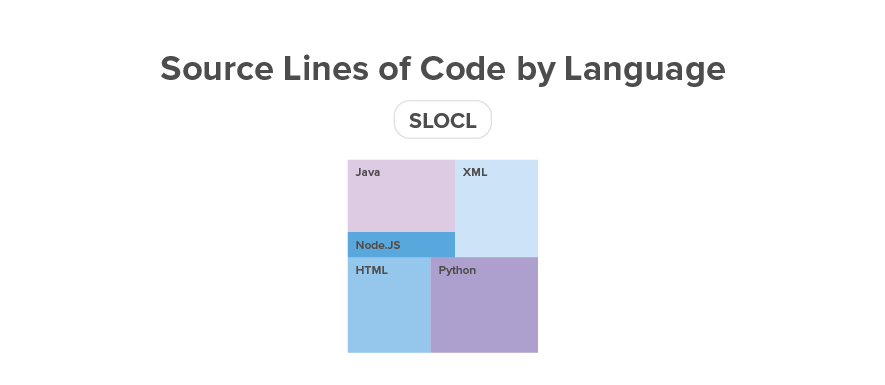
Source Lines of Code by Language (SLOCL)
Definition
Source Lines of Code by Language (SLOCL) measures lines of code for each programming language used by an organization.
Calculation
SLOCL = Number of lines of code in the application source code repository written in a specific programming language.
Analysis
This metric shows codebase breakdown by technology and programming language. This information is used to select source code analysis tools (typically SAST) to be used by an organization.
Source Lines of Code Change (SLOCC)
Definition
Source Lines of Code Change (SLOCC) is the number of lines of code changed in the source code repository in a particular release.
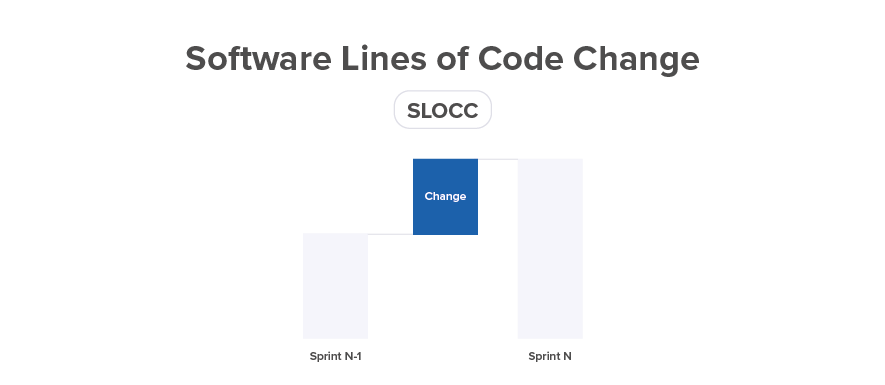
Calculation
SLOCC = Number of changed (new or modified) lines of source code (measured by Count Lines of Code CLOC tool) that were brought into the main branch by merge requests during a particular release.
Analysis
This metric shows the volume of code changes. Changed source code is a potential source of new vulnerabilities. Codebases with minimum code changes are more stable from a software security perspective. Applications with a large amount of source code change will require more attention from security teams.
Software Security Risk
Security Technical Debt (STD)
Definition
STD is the total number of not resolved vulnerabilities in production. This metric is measured at the time when the code is released into production.
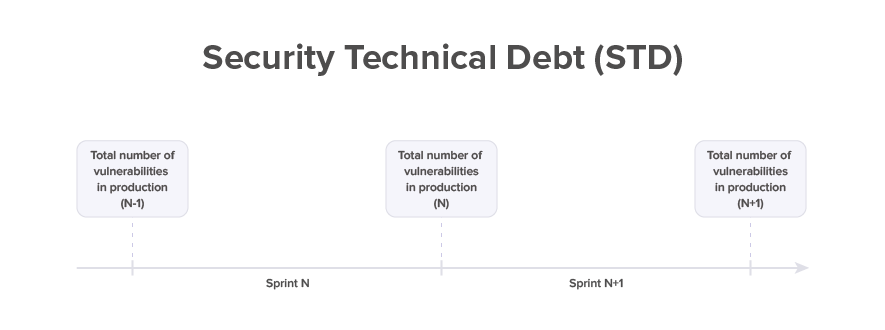
Calculation
STD = Number of vulnerabilities in production environment.
STDS = STD by Severity (critical, high, medium, low).
Analysis
STD should be zero for critical and high vulnerabilities. This metric should be getting smaller and smaller from release to release, so measuring the trend over time is important.
Mean Vulnerability Age (MVA)
Definition
Mean Vulnerability Age (MVA) is an average age of all not resolved security vulnerabilities from the time a vulnerability got checked in with a new code until the current moment when the vulnerability is not yet resolved.

Calculation
MVA = Average age across all not resolved software vulnerabilities. Individual vulnerability age is current time minus vulnerability detection time. This metric applies to vulnerabilities that have not yet been resolved.
MVAS = MVA by Severity (critical, high, medium, low).
Analysis
The goal is to minimize the age of vulnerabilities in production. This metric typically will be measured for critical and high vulnerabilities that should not be found in production and their MVA should be zero. MVA can be tracked over time to analyze progress. MVA is used to calculate Security Risk Exposure (SRE).
Security Risk Exposure (SRE)
Definition
Security Risk Exposure (SRE) is a multiple of STD with MVA.

Calculation
SRE = STD * MVA
Analysis
This metric calculates an aggregated risk that is proportionate to the number of vulnerabilities and how long these vulnerabilities are present in a production environment. This metric should not increase over time from sprint to sprint. Hence STD should be reduced over time faster than increase in MVA from sprint to sprint. This metric will be calculated and used for Critical and High severity vulnerabilities.
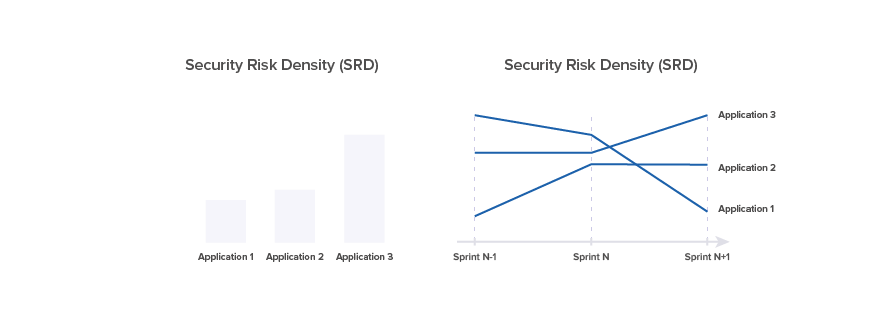
Security Risk Density (SRD)
Definition
SRD is measured for each application from release to release as STD per 1,000 lines of source code. It is a good indicator of software security risk at application level.
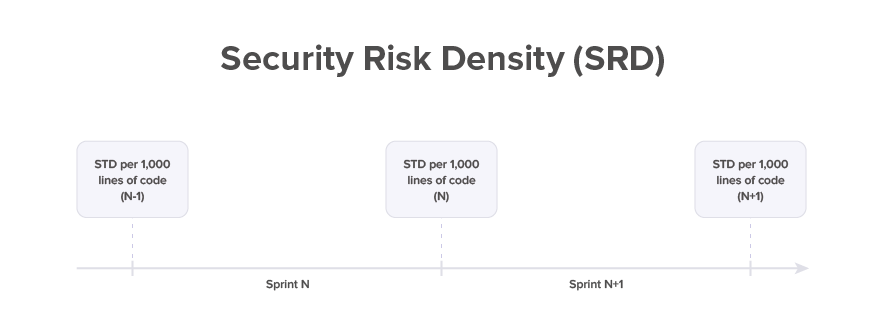
Calculation
SRD = Number of vulnerabilities that got released into production divided by the total number of lines of code. This metric applies to vulnerabilities that got into production and is best measured at the time when the code is released.
SRDS = SRD by severity
Analysis
This metric should be zero for critical and high vulnerabilities. This metric should be getting smaller and smaller from release to release, so measuring the trend over time is important.
Application Risk Score (ARS)
Definition
Application Risk Score (ARS) is calculated using a formula that considers the size of an application, the application business value and other aspects.
Calculation
Application Risk Score is calculated based on evaluation of a number of parameters which are grouped in two categories—Impact (potential impact to business in case of security breach) and Probability (likelihood of such security breach for particular application / microservice).
Below is a proposed sample split of parameters along with their weights. However, within each software delivery organization this approach could be adjusted and used as a framework.
|
Category |
Parameter |
Weight, %% |
|
Impact |
Compliance |
10% |
|
Impact |
Data Type |
5% |
|
Probability |
Internet Access |
5% |
|
Probability |
Partner Network Access |
10% |
|
Impact |
User Profile |
5% |
|
Probability |
External Users |
5% |
|
Impact |
Client Profile Records |
10% |
|
Probability |
Internal Users |
10% |
|
Probability |
Technology Risk |
10% |
|
Impact |
Application Business Value |
10% |
|
Impact |
Core Function |
10% |
|
Probability |
Software Engineering Stage |
10% |
|
|
TOTAL |
100% |
In the table below, for each parameter, corresponding values and score are proposed. Score should be counted depending on specifics of application / microservice being evaluated.
|
Category |
Parameter |
Parameter Value |
Impact Value |
Score |
|
Impact |
Compliance |
PCI DSS |
High |
3 |
|
Impact |
Compliance |
HIPAA |
High |
3 |
|
Impact |
Compliance |
N/A |
N/A |
0 |
|
Impact |
Data Type |
Payment Cards |
High |
3 |
|
Impact |
Data Type |
Financial Transactions |
Medium |
2 |
|
Impact |
Data Type |
Personally Identifiable Information |
Low |
1 |
|
Impact |
Data Type |
N/A |
N/A |
0 |
|
Probability |
Internet Access |
Outbound |
High |
3 |
|
Probability |
Internet Access |
Inbound |
Medium |
2 |
|
Probability |
Internet Access |
No Access (intranet) |
Low |
1 |
|
Probability |
Internet Access |
N/A |
N/A |
0 |
|
Probability |
Partner Network Access |
Outbound |
High |
3 |
|
Probability |
Partner Network Access |
Inbound |
Medium |
2 |
|
Probability |
Partner Network Access |
VPN |
Low |
1 |
|
Probability |
Partner Network Access |
N/A |
N/A |
0 |
|
Impact |
User Profile |
Financial Institute |
High |
3 |
|
Impact |
User Profile |
Legal Entity |
Medium |
2 |
|
Impact |
User Profile |
Individual |
Low |
1 |
|
Impact |
User Profile |
N/A |
N/A |
0 |
|
Impact |
Client Profile Records |
> 1 000K |
High |
3 |
|
Impact |
Client Profile Records |
> 1K < 1 000K |
Medium |
2 |
|
Impact |
Client Profile Records |
< 1K |
Low |
1 |
|
Impact |
Client Profile Records |
N/A |
N/A |
0 |
|
Probability |
External Users |
> 1 000K |
High |
3 |
|
Probability |
External Users |
> 1K < 1 000K |
Medium |
2 |
|
Probability |
External Users |
< 1K |
Low |
1 |
|
Probability |
External Users |
N/A |
N/A |
0 |
|
Probability |
Internal Users |
> 1 000K |
High |
3 |
|
Probability |
Internal Users |
> 1K < 1 000K |
Medium |
2 |
|
Probability |
Internal Users |
< 1K |
Low |
1 |
|
Probability |
Internal Users |
N/A |
N/A |
0 |
|
Probability |
Technology Risk |
High |
High |
3 |
|
Probability |
Technology Risk |
Medium |
Medium |
2 |
|
Probability |
Technology Risk |
Low |
Low |
1 |
|
Probability |
Technology Risk |
N/A |
N/A |
0 |
|
Impact |
Application Business Value |
МС (Mission Critical) |
High |
3 |
|
Impact |
Application Business Value |
BС (Business Critical) |
High |
3 |
|
Impact |
Application Business Value |
BO (Business Operation) |
Medium |
2 |
|
Impact |
Application Business Value |
OP (Office Productivity) |
Low |
1 |
|
Impact |
Application Business Value |
NC (Non-Classified) |
Low |
1 |
|
Impact |
Application Business Value |
N/A |
N/A |
0 |
|
Impact |
Core Function |
Payments and Funds Transfer |
High |
3 |
|
Impact |
Core Function |
Business Process Support |
Medium |
2 |
|
Impact |
Core Function |
Decision Making |
High |
3 |
|
Impact |
Core Function |
Data Analysis |
Low |
1 |
|
Impact |
Core Function |
Data Transfer |
Medium |
2 |
|
Impact |
Core Function |
N/A |
N/A |
0 |
|
Probability |
Software Engineering Stage |
Active Development |
High |
3 |
|
Probability |
Software Engineering Stage |
New Development |
High |
3 |
|
Probability |
Software Engineering Stage |
Maintenance |
Medium |
2 |
|
Probability |
Software Engineering Stage |
Retirement |
Low |
1 |
To calculate the impact value for each parameter, it is required to pick the score corresponding to the parameter value from the table above. Then for each parameter the value is multiplied by the parameter’s weight. Thus, Impact Score, Probability Score and the overall Application Risk Score can be calculated using the following formulas:

where:
- IMPACT = (Compliance, Data Type, User Profile, Client Profile Records, Application Business Value, Core Function)
- PROBABILITY = (Internet Access, Partner Network Access, External Users, Internal Users, Technology Risk, Software Engineering Stage)
- Max Impact Score is a maximum score of 3 for each parameter in the Impact category
- Max Probability Score is a maximum score of 3 for each parameter in the Probability category
Impact Score and Probability Score can be defined as Low/Medium/High/Critical severity using the following table:
|
Impact Score / Probability Score |
Severity |
|
0–49% |
Low |
|
50–69% |
Medium |
|
70–84% |
High |
|
85–100% |
Critical |
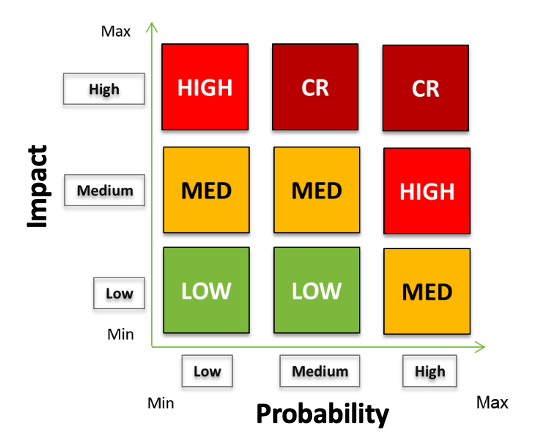
Application Risk Severity can be defined as Low/Medium/High/Critical based on the severity of Impact Score and Probability Score using the following table:
|
Application Risk Severity |
Impact |
||||
|
Low |
Medium |
High |
Critical |
||
|
Probability |
Low |
Low |
Medium |
Medium |
Medium |
|
Medium |
Low |
Medium |
Medium |
High |
|
|
High |
Low |
Medium |
High |
Critical |
|
|
Critical |
Medium |
High |
Critical |
Critical |
|
Analysis
This metric is used to translate the security risk for a specific application into business risk for an organization. An application can have a large number of vulnerabilities, but it may not contain any critical data or enable access to any customer data. Accordingly, business risk for such applications will be lower and ARS metric will be smaller.
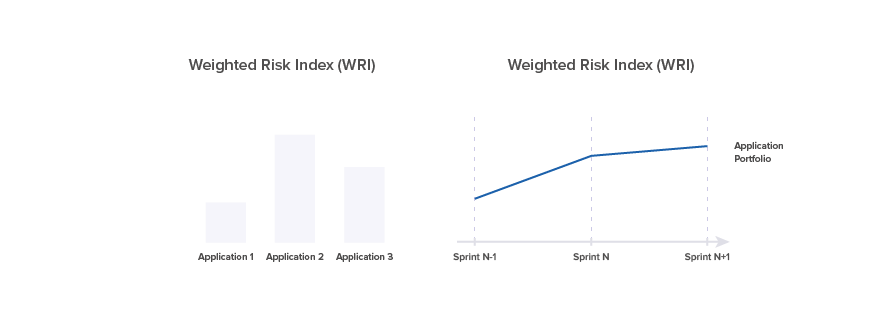
Weighted Risk Index (WRI)
Definition
Weighted Risk Index (WRI) measures business risk for a portfolio of applications. For a given portfolio of applications, the overall security risk needs to take into account application risk score as a proportionate contribution of this application to the overall application portfolio risk.
Calculation
Application Portfolio WRI = WRI App 1 + WRI App 2 + WRI App 3. Application Portfolio WRI metric is a total of Application WRI numbers.
Application WRI App N = ((Multiplier-Critical * Critical-Vulnerabilities) + (Multiplier-High * High-Vulnerabilities) + (Multiplier-Medium * Medium-Vulnerabilities) + (Multiplier-Low * Low-Vulnerabilities)) * ARS. Application WRI has a multiplier for each severity and an Application Risk Score.
Analysis
This metric applies to vulnerabilities that have been detected and are in production. The metric enables organizations to measure aggregated business risk for an application portfolio for every release and track it over time. It is a business risk representation of application security risk. This metric should reduce over time.
Security Risk Reduction
Security Technical Debt Change (STDC)
Definition
Security Technical Debt Change (STDC) tracks changes in the production in a specific application from release to release. This metric applies to production vulnerabilities and is best measured at the time when the code is released.

Calculation
Change in number of production vulnerabilities by severity (critical, high, medium, low) during transition to next release.
Analysis
This metric should be zero for critical and high vulnerabilities, assuming that there are no critical or high vulnerabilities in production. This metric should indicate a decrease of production vulnerabilities from release to release.
Vulnerability Open Rate (VOR)
Definition
Vulnerability Open Rate (VOR) tracks how many new vulnerabilities have been identified during release. This metric is best measured at the time when the code is released into production.

Calculation
VOR = Number of new vulnerabilities that have been found within release.
VORS = VOR by severity (critical, high, medium, low).
Analysis
VOR indicates the quality of new code and code modifications from a security perspective. On the one hand this metric should be getting smaller and smaller over time, indicating that software quality is growing. On the other hand, when vulnerability detection techniques are becoming more effective, the higher VOR from release to release may indicate that a smaller number of vulnerabilities have been missed. Hence, this metric should be analyzed along with other indicators.
Vulnerability Escape Rate (VER)
Definition
Vulnerability Escape Rate (VER) tracks how many new vulnerabilities get into production. New vulnerabilities are those detected during the current sprint. This metric applies to vulnerabilities that got into production and is best measured at the time when the code is released into production.
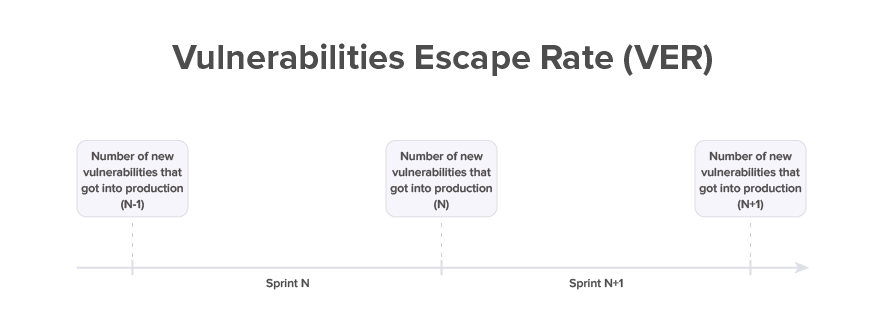
Calculation
VER = Number of new vulnerabilities that have been detected, but not fixed and got released into production.
VERS = VER by severity (critical, high, medium, low).
Analysis
This metric should be zero for critical and high vulnerabilities. VER helps understand the effectiveness of security testing and development team ability to continuously reduce Security Technical Debt (STD). This metric should be getting smaller and smaller from release to release, so measuring the trend is important.
Vulnerability Resolved Rate (VRR)
Definition
Vulnerability Resolved Rate (VRR) tracks how many vulnerabilities have been resolved in a specific release. This metric is best measured at the time when the code is released into production.

Calculation
VRR = Number of newly detected vulnerabilities and older vulnerabilities from Security Technical Debt that have been resolved during release.
VRR = VRR by severity (critical, high, medium, low)
Analysis
This metric should be higher than VER for critical and high vulnerabilities which is an indicator that new vulnerabilities don’t squeeze into production. The VRR helps understand the effectiveness of the development team’s ability to continuously reduce Security Technical Debt (STD) and prevent new vulnerabilities from escaping into production. This metric should be getting higher and higher from release to release according to Technical Debt elimination strategy, so measuring the trend is important.
Secure Engineering
Opened To Resolved Ratio (OTRR)
Definition
Opened To Resolved Ratio (OTRR) measures the ratio between opened and resolved vulnerabilities in a release.
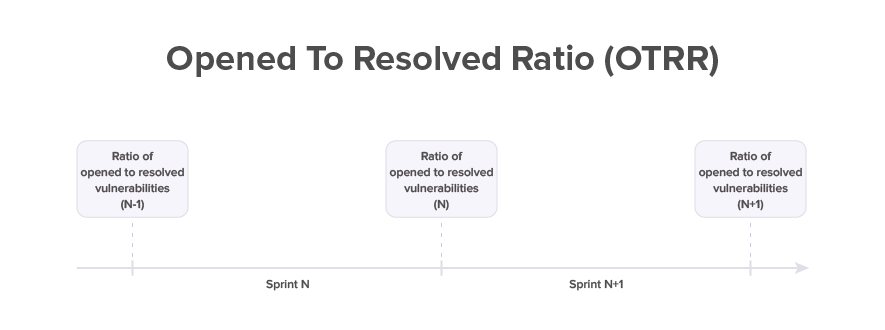
Calculation
OTRR % = Number of all opened vulnerabilities (newly opened and re-opened) during the release divided by the number of resolved vulnerabilities within this release.
Analysis
OTRR applies to vulnerabilities that have been detected. This metric compares the number of vulnerabilities introduced by development team during release vs their productivity in resolving known vulnerabilities. This metric should be much less than 100%, so that the team is resolving more vulnerabilities than creating. Ideally, this metric should be less than 10%.
Re-Opened To Opened Ratio (RTOR)
Definition
The ratio of re-opened to opened vulnerabilities during a particular release.
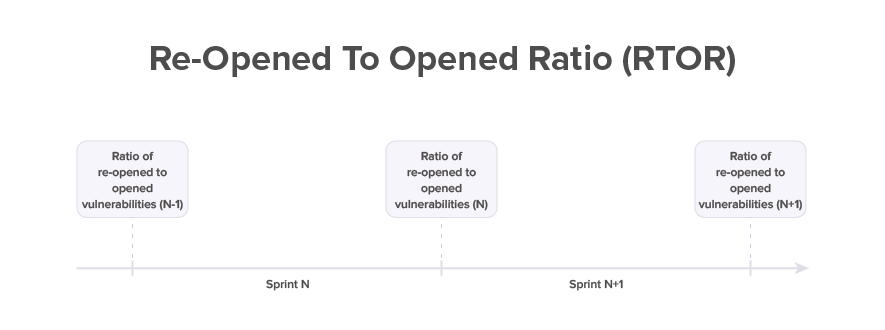
Calculation
RTOR % = Number of all re-opened vulnerabilities divided by the number of all opened vulnerabilities (including re-opened).
Analysis
The metric measured the quality of how well the vulnerabilities were fixed by developers from release to release. The metric should reduce over time.
Passed Security Gates Ratio (PSGR)
Definition
Passed Security Gates Ratio (PSGR) compares the number of scans with passed quality gates to the total number of scans (failed and passed) during release. This metric determines how often security gates pass successfully.
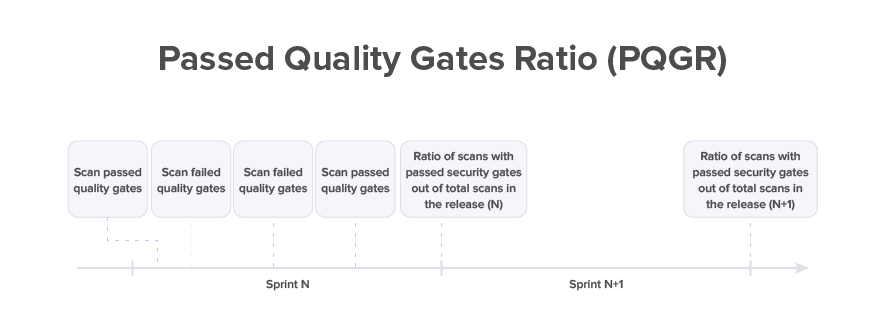
Calculation
PSGR % = The number of scans with passed security gates divided by total number of security scans in a particular release. Security gate is counted as passed when security policies are not violated, for example when there are no critical and high severity vulnerabilities.
PSGRP = PSGR % measured by security practice (SAST, DAST, SCA, etc.).
Security Gate Staging Matrix can be defined and used as quality criteria for security gate. This matrix can be defined as follows, for example:
|
Security Gate |
New Vulnerabilities |
Total Vulnerabilities |
||||||
|
Critical |
High |
Medium |
Low |
Critical |
High |
Medium |
Low |
|
|
SAST |
0 |
0 |
10 |
Any |
0 |
0 |
20 |
Any |
|
SCA |
0 |
0 |
2 |
Any |
0 |
0 |
5 |
Any |
|
DAST |
0 |
0 |
2 |
Any |
0 |
0 |
5 |
Any |
Analysis
This metric indicates overall software quality dynamics within a release. This metric ideally should be close to 100%.
DevSecOps Speed
Mean Time In Production (MTIP)
Definition
Mean Time In Production (MTIP) describes average length of time a vulnerability spends in production before it is remediated and fixed (removed from production environment). This metric applies to vulnerabilities that have already been resolved after they got into production. It is measured at the time when the code is released into production.

Calculation
MTIP = Duration measured in days from the time when a vulnerability got into the production environment with a certain release until the time the fixed code is deployed into the production environment as a patch or with the upcoming next release.
MTIP [Severity] = MTIP by severity (Critical, High, Medium, Low). This metric typically will be measured for critical and high vulnerabilities that by company standard should not be found in production.
Analysis
MTIP ideally should be equal to zero for critical and high vulnerabilities. If this metric is more than one Release Duration, that means (a) such vulnerabilities were not detected in several releases consequently or (b) it took much more time to fix than one Release Duration. MTIP trend is tracked over time to analyze progress.
Mean Time To Detect (MTTD)
Definition
Mean Time To Detect (MTTD) is the time it takes to detect a vulnerability after new code containing it has been checked in. This metric applies to vulnerabilities that have been detected.

Calculation
MTTD = Duration in days from the time when the new code containing vulnerability was checked in until the time this vulnerability has been detected.
Analysis
The goal is to detect vulnerabilities as early as possible and not near the end of the release. MTTD trend is tracked over time to analyze progress. MTTD needs to reach low levels to enable the software engineering Shift-Left paradigm.
MTTD should ideally not exceed 30% of Release Duration. If MTTD is longer than Release Cycle, that means that vulnerabilities escape into production and application security is deteriorating. When MTTD is less than 30% of Release Duration, vulnerabilities are identified at the beginning of development and there is sufficient time for them to be fixed within same release.
Mean Time to Resolve (MTTR)
Definition
MTTR is the average time required to resolve security defect by engineering team. This metric applies to vulnerabilities that have been resolved.

Calculation
MTTR = Duration in days from the time the vulnerability is detected to the time the vulnerability is resolved.
Analysis
The goal is to resolve defects quickly according to priority and not let unfixed defects into production. MTTR should be less than 30% of Release Duration. When MTTR is less than 30% of Release Duration, vulnerabilities identified in the middle of release will still be fixed within the same release before deploying into production. If MTTR is more than 30% of Release Duration, some vulnerabilities found in the later part of the release may not be fixed before the end of the release and they will escape into production. If MTTR is larger than Release Cycle, all new vulnerabilities escape into production and application security is not stable. MTTR trend is tracked over time to analyze progress.
DevSecOps Performance
Shift-Left Detection Ratio (SLDR)
Definition
Shift-Left Detection Ratio (SLDR) is a percentage of vulnerabilities detected in each environment out of the total number of vulnerabilities detected in a release.

Calculation
SLDR % = Number of vulnerabilities detected in different environments (Development, Staging, Pre-Production, Production) divided into the total number of vulnerabilities detected during release.
Analysis
SLDR indicates an ability to identify security flaws early within development lifecycle. This metric ideally should have the following values: SLDR for Development – 60%, for Staging – 30%, Pre-Production – 10%, Production – 0%.
Failed Security Pipelines Ratio (FSPR)
Definition
Failed Security Pipelines Ratio (FSPR) is a percentage of not completed security pipelines to the total number of executed security pipelines in a release.
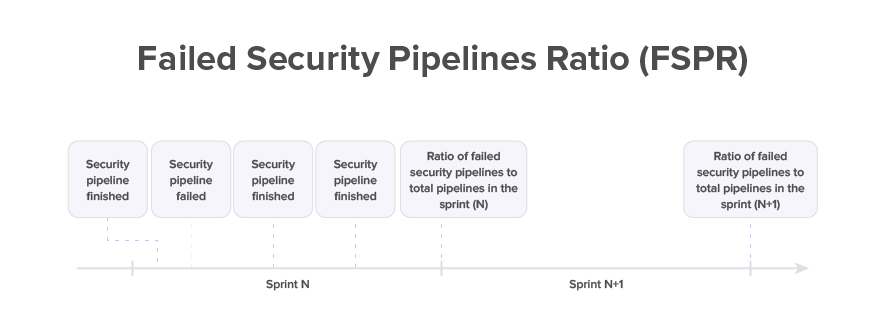
Calculation
FSPR = Number of security pipelines with status “failed” divided by the total number of security pipelines executed during release.
Analysis
FSPR applies to security pipelines initiated during a particular release. This metric indicates overall quality of DevSecOps operations. Ideally it should be equal to zero.
Scans in Queue Time (SQT)
Definition
Scans in Queue Time (SQT) is the wait time of a scan task from the moment it is added to the queue to the time when execution of this scan starts. This metric applies to all types of security scans.

Calculation
SQT = Time when task execution starts in the pipeline minus time when this task has been added to the queue in security CI/CD pipeline.
Analysis
SQT should ideally be equal to zero and not growing over time, when more and more applications are added into DevSecOps scope.
Security Scan Time (SST)
Definition
Security Scan Time (SST) indicates how long it takes for a security scan to occur.

Calculation
SST = Duration of security scan from the time of initiation until the time of successful completion.
SST [Practice] = SST by practice (SAST, DAST, SCA, etc.).
Analysis
SST is measured in hours. This metric may serve as an indicator to add compute capacity in order to bring scan time to a reasonable duration.