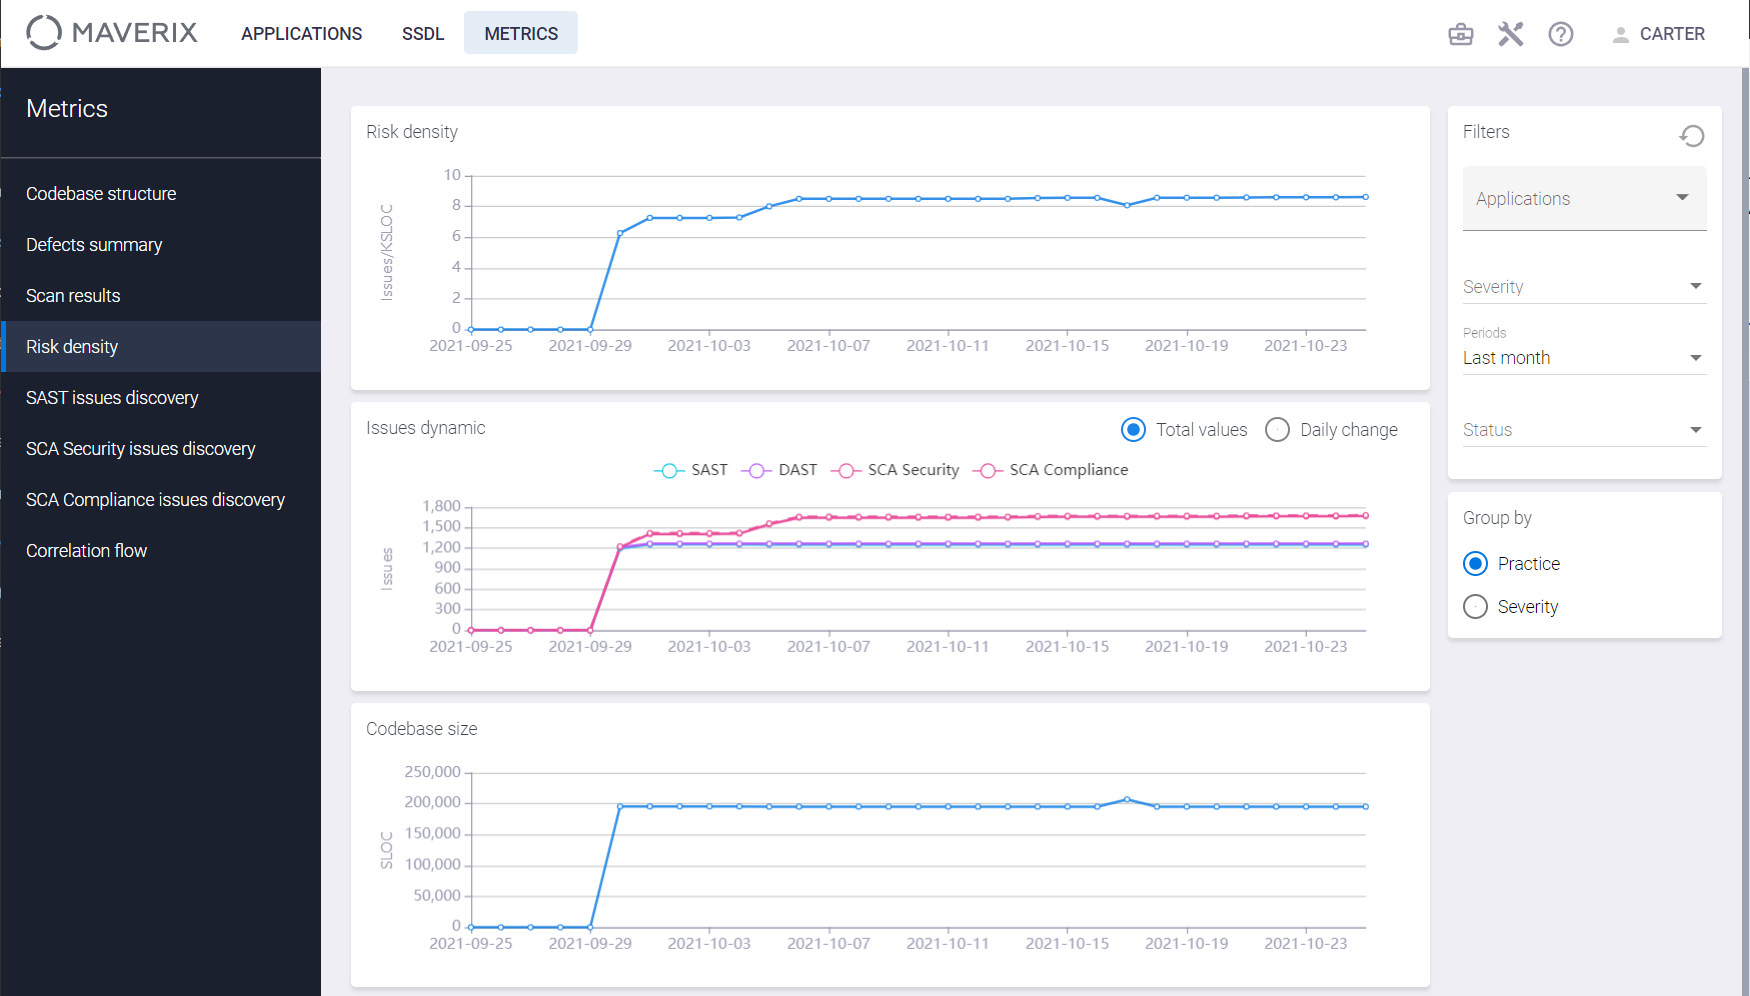
Risk Density
To start the work with the metrics on the Risk density page, it’s necessary to select the time interval using the Periods drop-down menu on the Filters tab at the top right. It’s possible to select an interval from the last week to the last three years. The following metrics are shown for the selected period:
- Risk density in dynamics, measured by the number of issues (risks) per KSLOC of the source code.
- Dynamic of issues by the four practices (SAST, DAST, SCA Security, SCA Compliance).
- The codebase size, measured in SLOC.
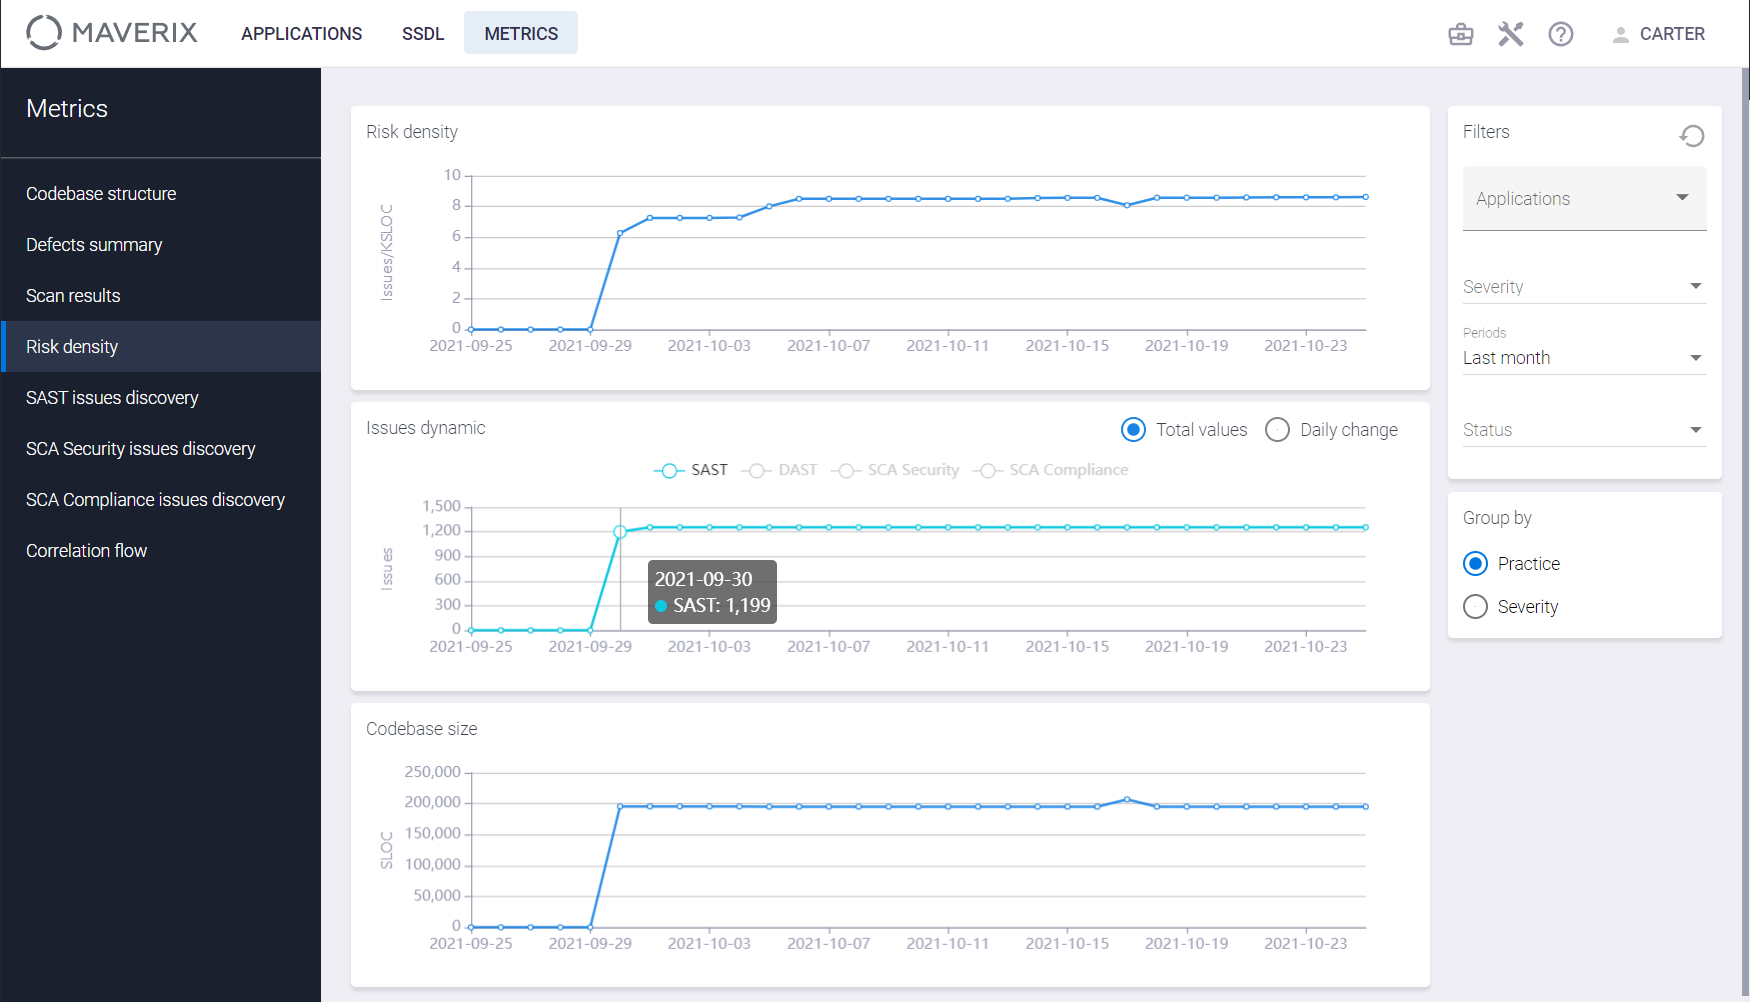
It is possible to to tune the Issues dynamic chart. To view the issue dynamic metrics for a single practice or for multiple practices, select the Practice item on the Group by tab and click the practice name (SAST, DAST, SCA Security, SCA Compliance) to include or exclude issues found by that practice from the chart. Thus, it’s possible to leave, for example, just one practice on this chart. Select the Total values or Daily change item to get the corresponding data view on the chart. Here is an example of the daily change in SAST issues for the last two years.
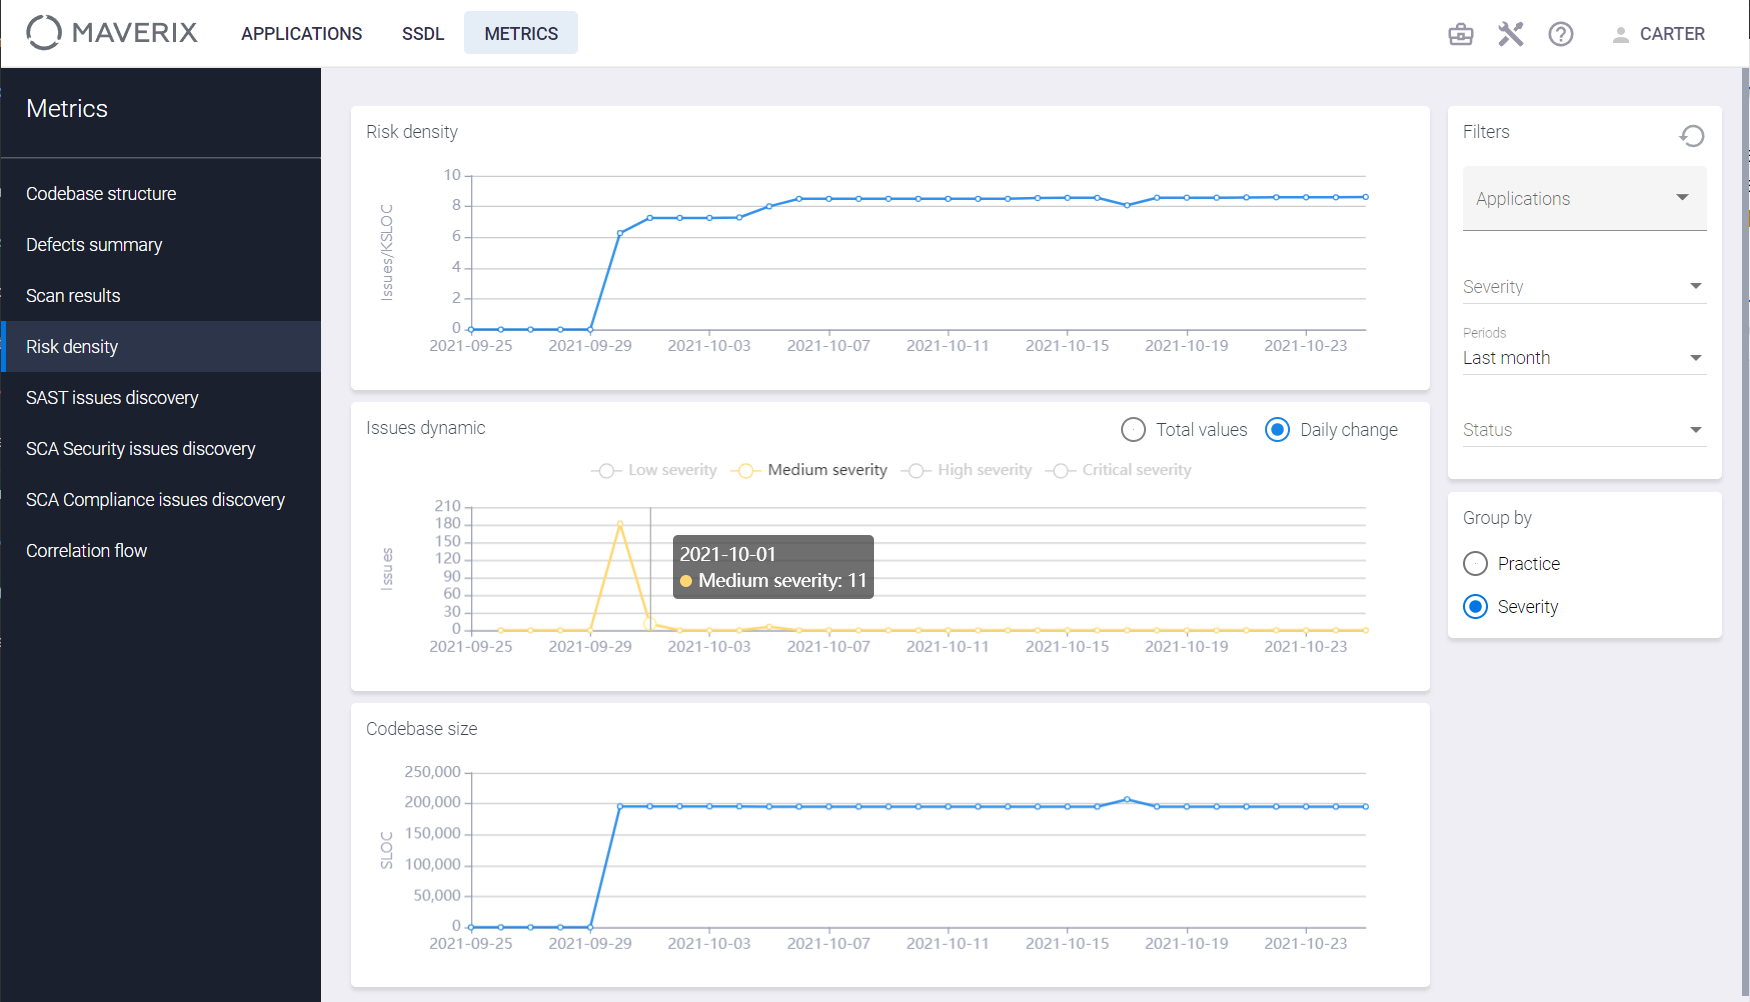
To get the issue dynamic metrics separated by severity, select the Severity item on the Group by tab and click the severity level (Low severity, Medium severity, High severity, Critical severity) to include or exclude issues of that severity from the issue dynamic chart. Choose the Total values or Daily change item to get the corresponding data view on the chart. Select the Total values or Daily change item to get the corresponding data view on the chart. Here is an example of the medium severity issue dynamic for the last two years.
To get the risk density metrics for a particular application(s), select the application(s) from the drop-down menu in the Applications field on the Filters tab at the top right.
Click the  button on the top right to reset filters.