Artifact Security Pipeline
Build tools consider source code compiled for execution or testing as an artifact. Artifacts are created by software engineering tools based on the source codebase. Artifacts are important from an application development perspective as entities that can be included in a delivery.
Select an application and click the Development menu item on the left. Artifacts are listed on the Artifacts tab.
Multiple artifacts (for example, WAR-files, distributions as archive files, Docker images, etc.) can exist for a single application source codebase.
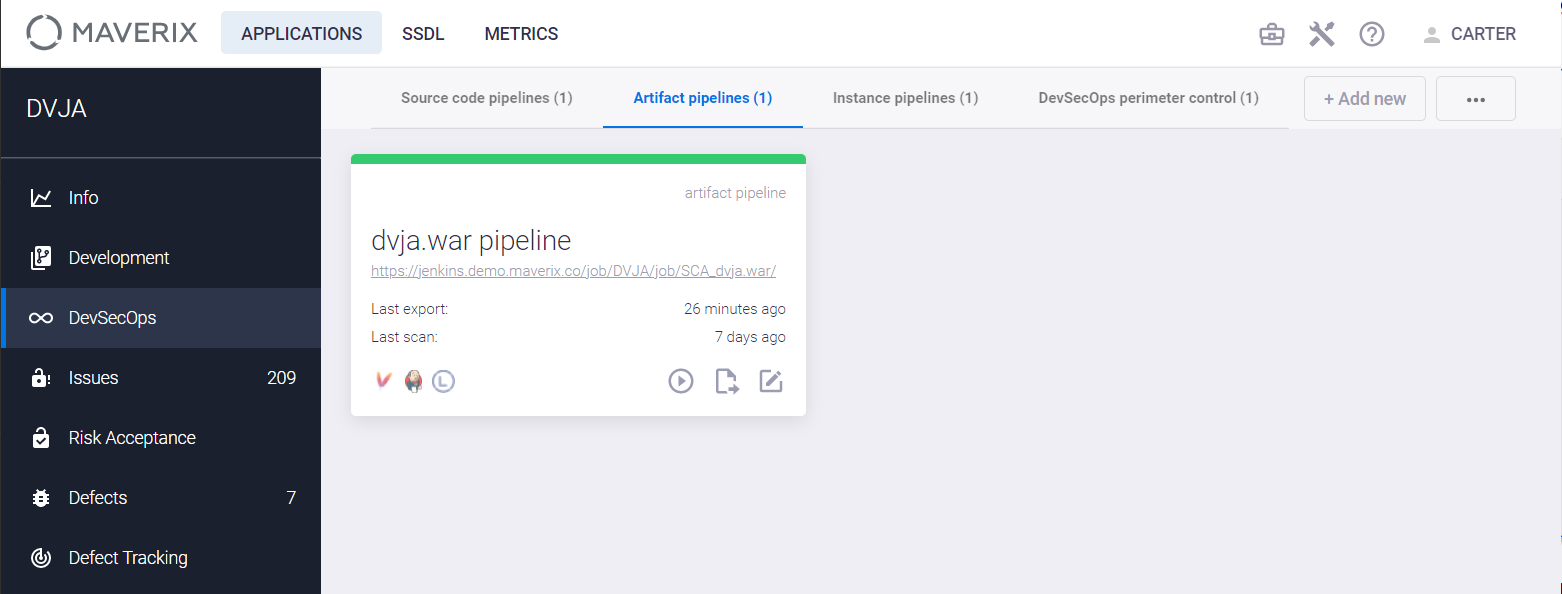
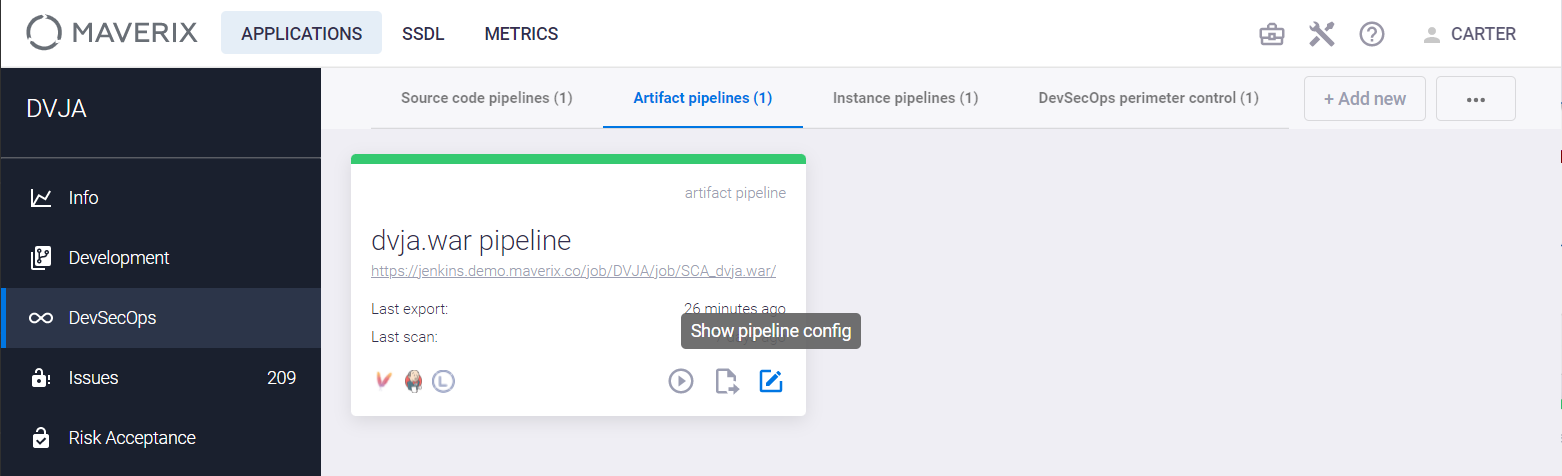
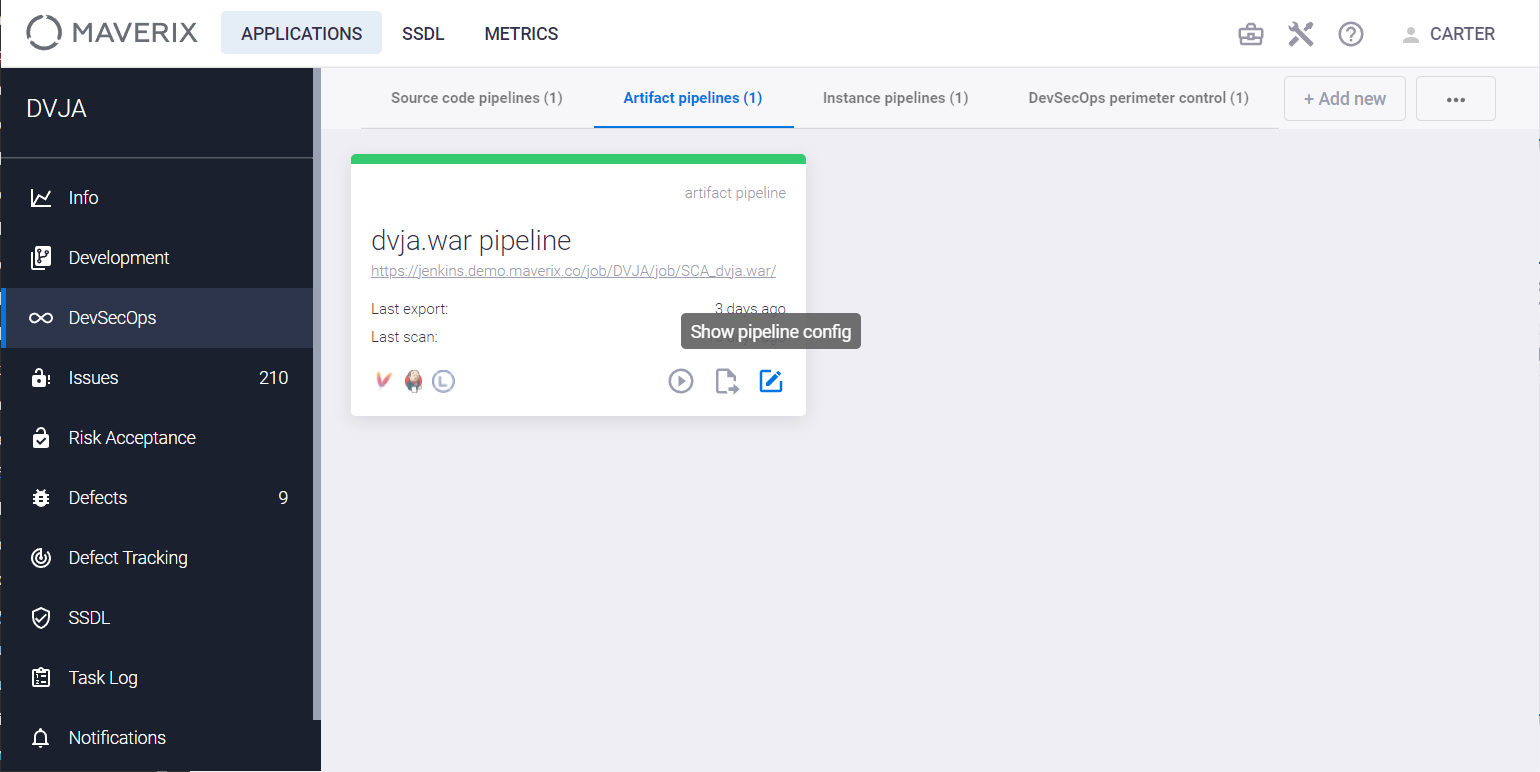
In terms of application security, each artifact can be scanned for security issues. Maverix helps to automate this process by supporting DevSecOps artifact pipelines. Click the DevSecOps menu item on the left and the Show pipeline config ![]() button in the artifact pipeline card on the Artifact pipelines tab to get details on the artifact pipeline.
button in the artifact pipeline card on the Artifact pipelines tab to get details on the artifact pipeline.
The pipeline details page appears.

This page contains five cards, or components, for the selected example of artifact pipeline:
- Artifact card.
- Orchestration tool card.
- AST card.
- Tagging card.
- Webhook card.
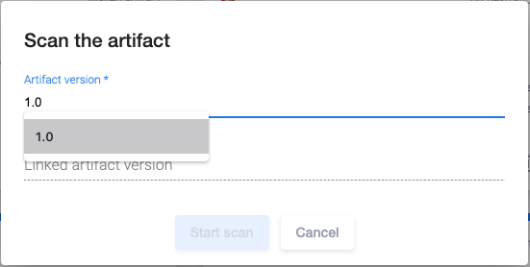
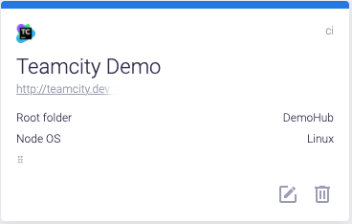
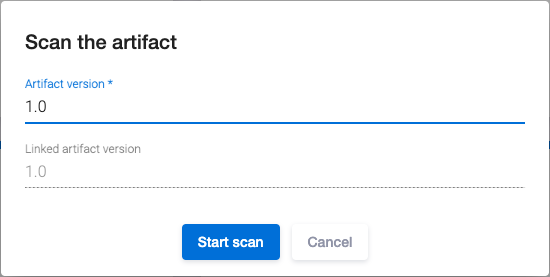
The Artifact card represents the artifact to be scanned for security issues. The version of the artifact to be scanned is specified as a parameter when starting the scan:
- To specify the artifact version, click the Actions
 button at the top right and select the Start scan item from the drop-down menu.
 - In the Scan the artifact window that appears, select the artifact version from the list of available versions in the Artifact version field.
- Click the Start scan button at the bottom to start scanning.
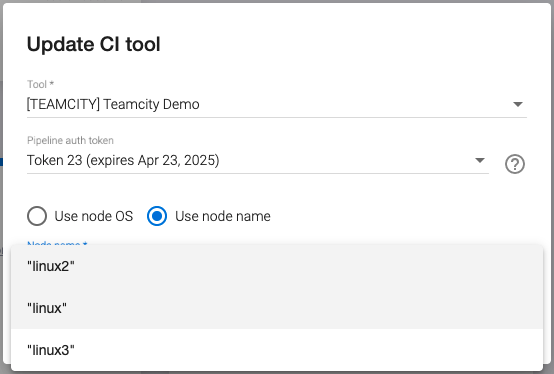
The next card for this pipeline is the TeamCity orchestration tool card. It allows you to configure the orchestration tool. If TeamCity runs on multiple nodes, you can select a particular node for scanning. To do this, select the label with which it’s marked. To select a labeled node (e.g., linux), click the edit  icon on the orchestration tool card. Select the Use node name mode in the Update CI tool window that opens, and choose linux from the drop-down list in the Node label field, and click the Update button.
A notification confirming the TeamCity configuration update appears at the bottom right.
The TeamCity tool card now contains information on the selected node with the linux label.
The scanning process will run on this node, labeled linux.
The next card for this pipeline is the AST tool card. In this example, it is the Nexus IQ Server tool. Several AST tools can be used for one pipeline. The Nexus IQ Server is SCA (Software Composition Analysis) scanning tool. Click the edit ![]() icon on the AST tool card to tune the scanning parameters in the Update SCA scan config.
icon on the AST tool card to tune the scanning parameters in the Update SCA scan config.
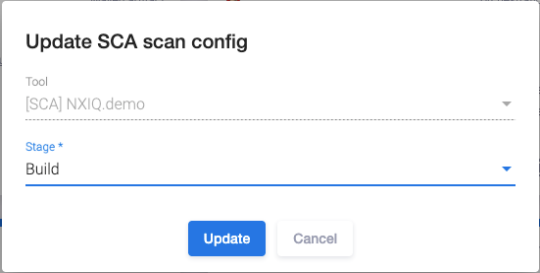
Here you can select the AST tool and stage from the drop-down list (Develop, Build, Stage Release, Release, and Operate).
Artifact tagging
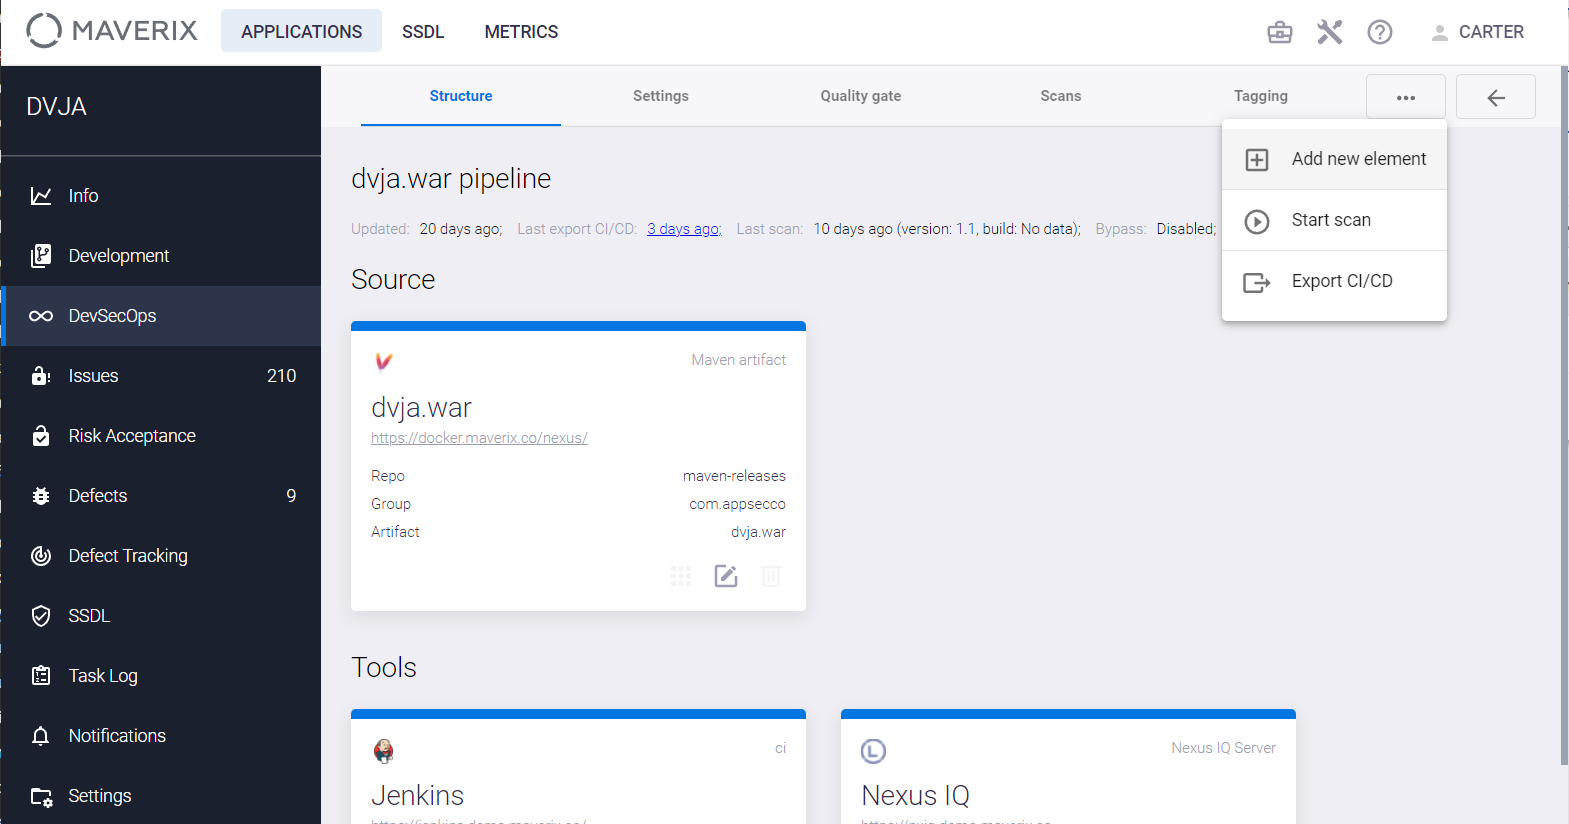
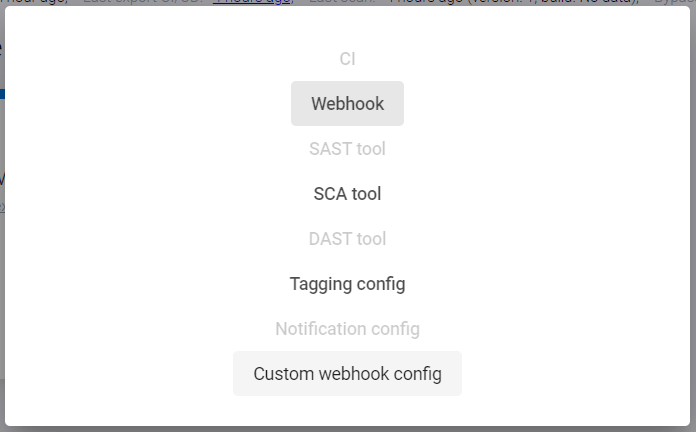
The Tagging card and the artifact tagging are optional. To add tagging to the artifact security pipeline, click the Actions ![]() button at the top right of the Structure tab and select Add new element from the drop-down menu. Select the Tagging config from the list in the window that appears.
button at the top right of the Structure tab and select Add new element from the drop-down menu. Select the Tagging config from the list in the window that appears.
Some repositories (e.g., Nexus Pro) support tagging. Tagging allows you to put labels on artifacts based on scan results. The Nexus IQ Server tool works in the SCA area. If the scan passes Quality Gate successfully, the artifact will be tagged with "QG_SCA_PASS", otherwise it will be tagged with "QG_SCA_FAIL". The absence of a tag on an artifact with defined QG means that the artifact has not yet been scanned. If QG is not set, and an artifact scan has been performed, the artifact will not be tagged at all as a result of this scan.
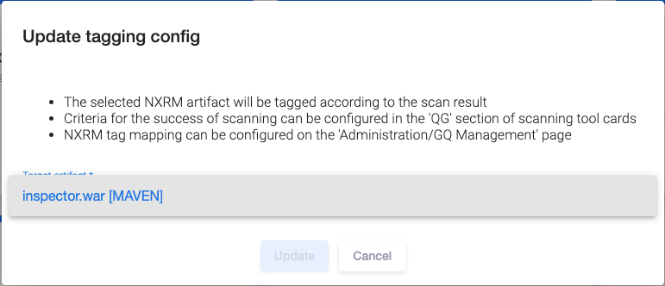
The tagging card allows you to automatically tag artifacts as a result of a security scan.
Click the edit ![]() icon on the Tagging card and select the artifact name from the Target artifact list in the Update tagging config window to define the artifact to be tagged.
icon on the Tagging card and select the artifact name from the Target artifact list in the Update tagging config window to define the artifact to be tagged.
 |
Tags that can be applied to an artifact are defined by the user with Administrator rights on the Administration page using the Tagging config menu item. The corresponding notification is located in the Update tagging config window. Configuring artifact tagging is described in the "Tagging Configuration" section of the Application Administrator Guide. |
Maverix defines the practice used during the scan (SAST, DAST, or SCA) and a scan result ("passed" or "failed"), chooses the corresponding tag from the list (e.g., "QG_SAST_PASS"), and labels the artifact with this tag.
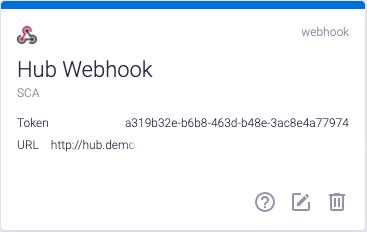
Webhooks
The Webhook card and the webhooks are optional. Essentially, a webhook is a method for notifying the system about some events. Using a webhook, you can start a pipeline when a predefined event occurs. For example, a webhook can be configured for a particular repository as follows: webhook is called if a particular predefined artifact is placed into that repository. The webhook settings can be seen in the Webhook card. Click the edit ![]() icon on this card to update settings.
icon on this card to update settings.
Webhook just sends a signal to start some processes. It doesn't use any feedback from the initiated processes. Webhook can be used not only for artifact pipelines but for source code pipelines, too. Typically, webhook can be set for a new source code merge. In this case, the security scan of the newly merged code should be launched automatically by webhook.
Custom webhook
In some cases, due to specific workflow, it's necessary to use non-standard ways of communication with external tools. For example, direct artifact tagging via the Nexus RM API may have some restrictions. This is often due to restricted access rights or other specific requirements. Custom webhooks can be used to overcome these limitations.
Note that the following conditions must be met for the normal operation of this mechanism. First, you need to specify the artifact tagging by adding the Tagging config to the security pipeline. Second, the Quality Gate profile should be connected to the security pipeline to enable the tagging mechanism to function.
Before enabling the Custom webhook configuration in the security pipeline, it's necessary to create it on the Administration page. For more information, see the "Custom Webhooks Configuration" section of the Application Administrator Guide.
Let's consider enabling Custom webhook using artifact security pipeline as an example. Including Custom Webhook into security pipeline of source code is done in the same way.
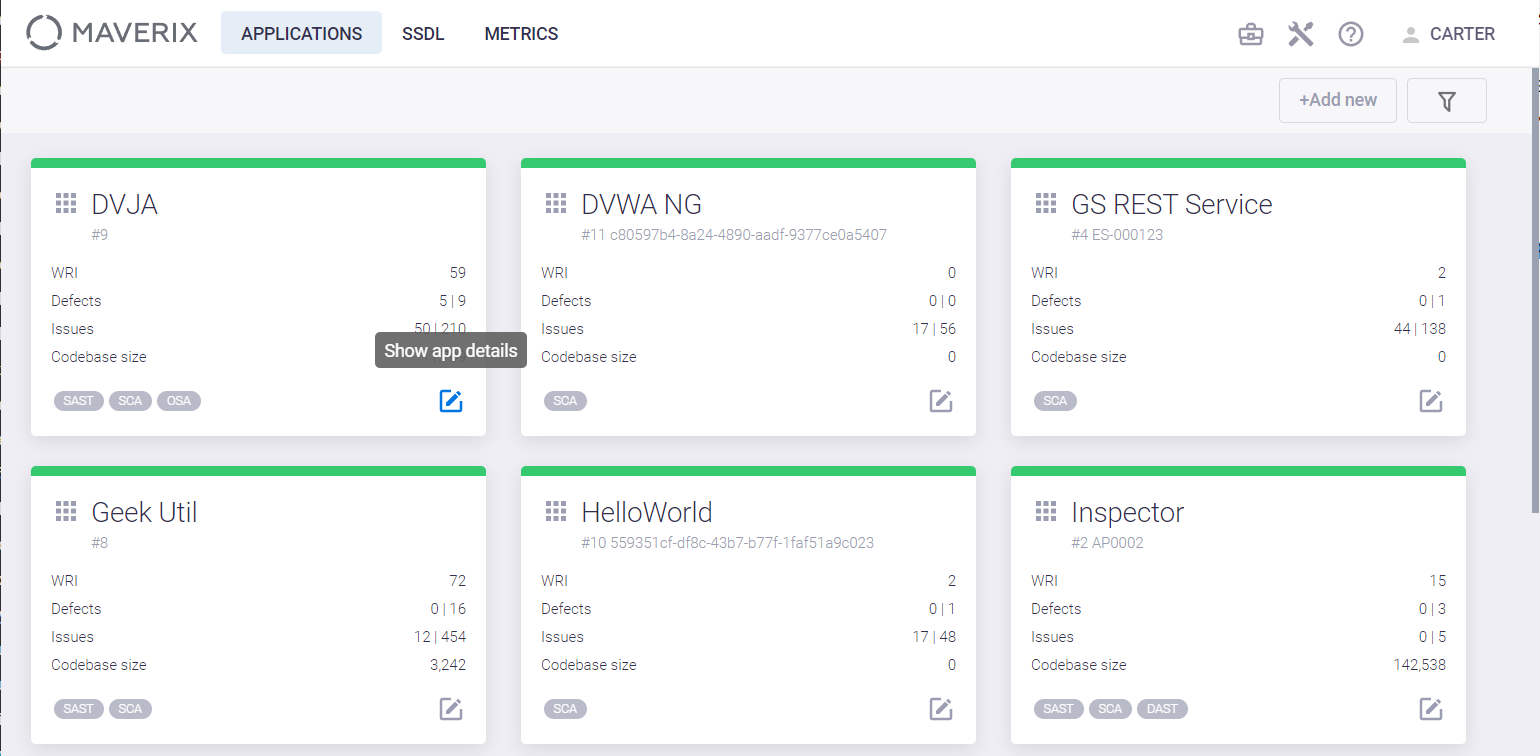
Select an application and click the Show app details ![]() icon in its card.
icon in its card.
Select the DevSecOps menu item on the left and go to the Artifact pipelines tab.
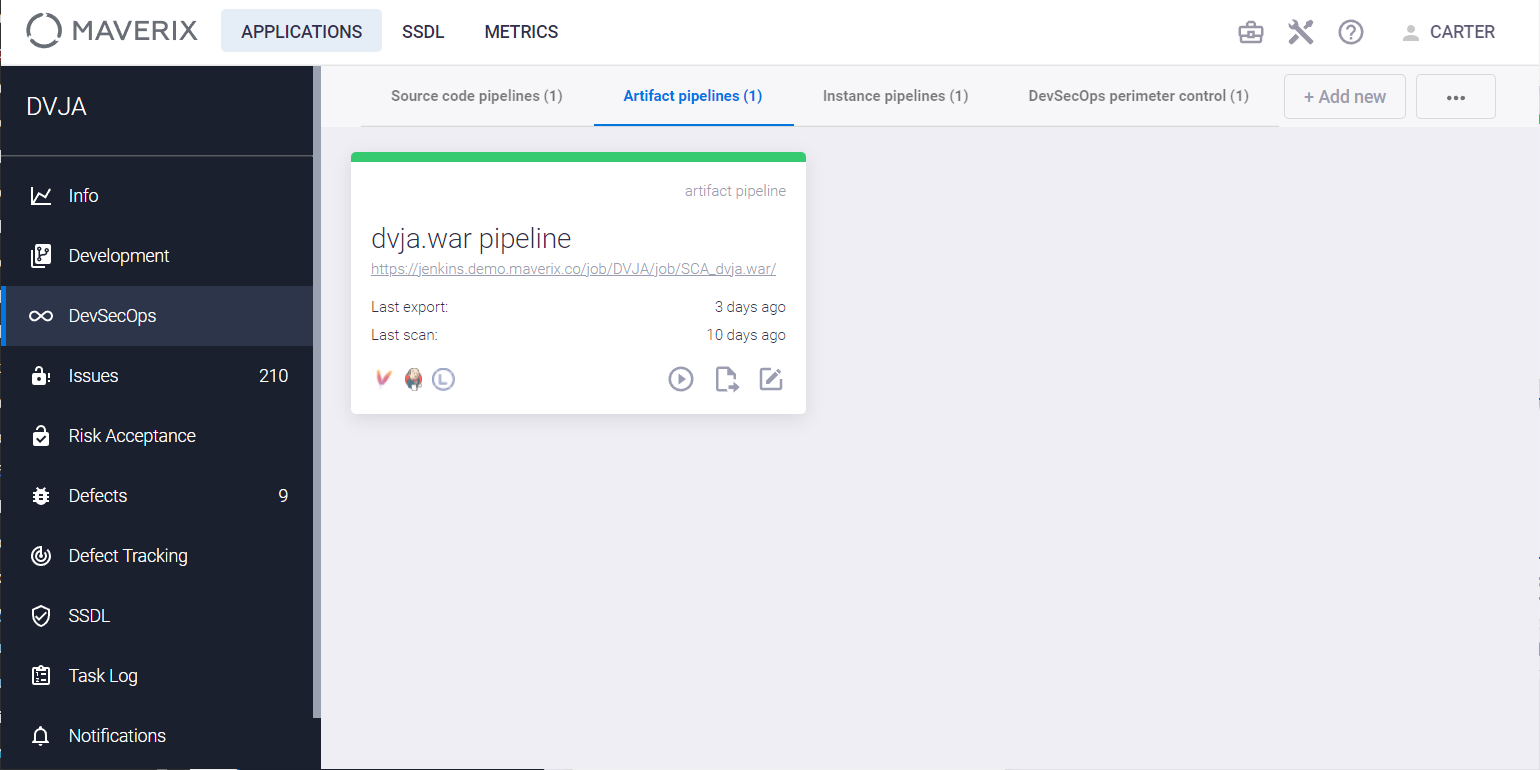
Click the Show pipeline config icon to open the Security Pipeline page.
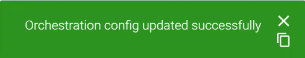
Click the Action button in the right upper corner of the Structure tab and select the Add new element item from the drop-down menu.
Select the Custom webhook config item in the dialog box that appears.
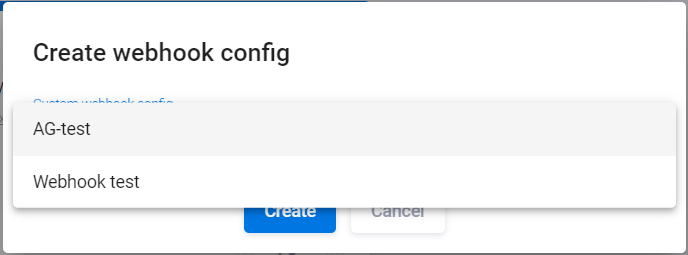
Select a previously created configuration from the drop-down menu in the dialog box that appears, then click the Create button.
Scanning
When all the DevSecOps artifact pipeline components have been configured, click the Actions ![]() button at the top right of the pipeline detail page and select the Export CI/CD item from the drop-down menu to export the newly created security pipeline to the CI/CD orchestration tool (TeamCity in this example).
button at the top right of the pipeline detail page and select the Export CI/CD item from the drop-down menu to export the newly created security pipeline to the CI/CD orchestration tool (TeamCity in this example).
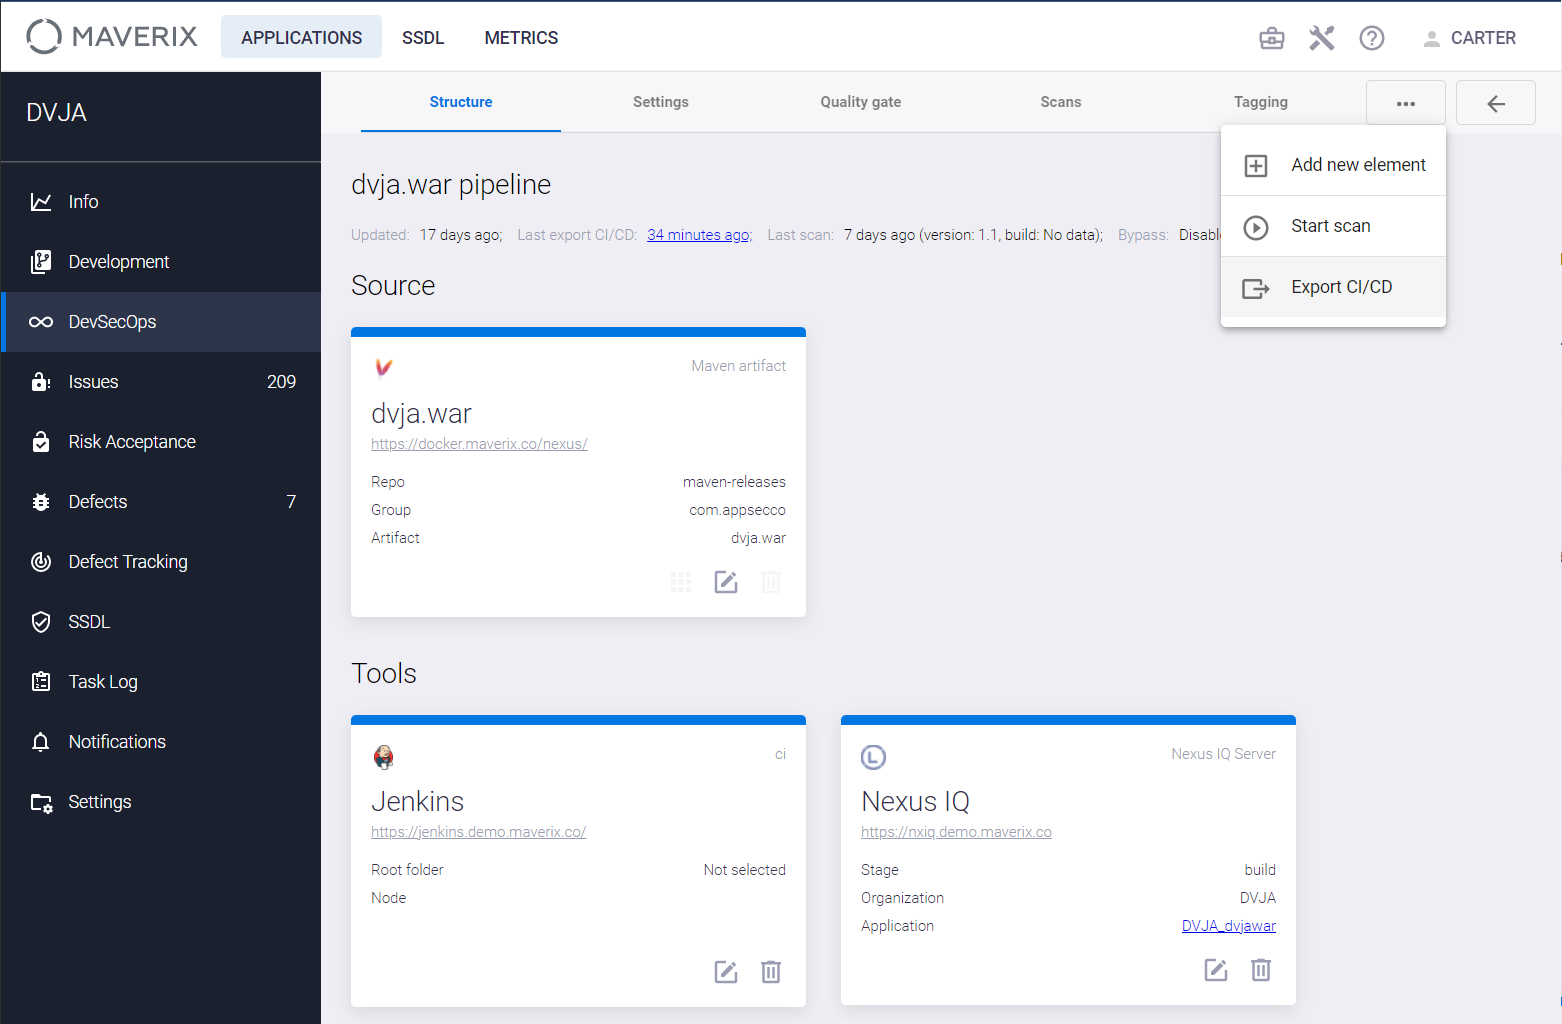
After the successful export to a CI/CD tool, click the Actions ![]() button and choose the Start scan item from the drop-down menu to start the artifact security scan using the Nexus IQ Server tool. The Scan the artifact window appears. Specify the artifact version in the Artifact version field and click the Start scan button to start scanning.
button and choose the Start scan item from the drop-down menu to start the artifact security scan using the Nexus IQ Server tool. The Scan the artifact window appears. Specify the artifact version in the Artifact version field and click the Start scan button to start scanning.
The confirmation message appears at the bottom right indicating that the scanning has started.
After a few seconds, this message will be replaced by the next one.
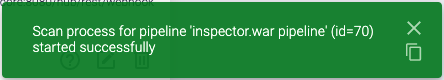
When the scan is complete, its results will be added to the Scan History tab.